MDR dashboard

Fully transparent
In costs, contracts, and security
Look over our shoulder
What we do, you see
Be prepared for an audit
With our monthly reporting

What is an MDR dashboard?

An MDR dashboard is the central hub of our Managed Detection & Response (MDR) service: a service where security specialists continuously monitor your devices, accounts, cloud, and email, and intervene when things go wrong. In the security dashboard, you can see what we see and do, all in plain language. No black-box solution, just full transparency.

Insight into the security status of your company or clients

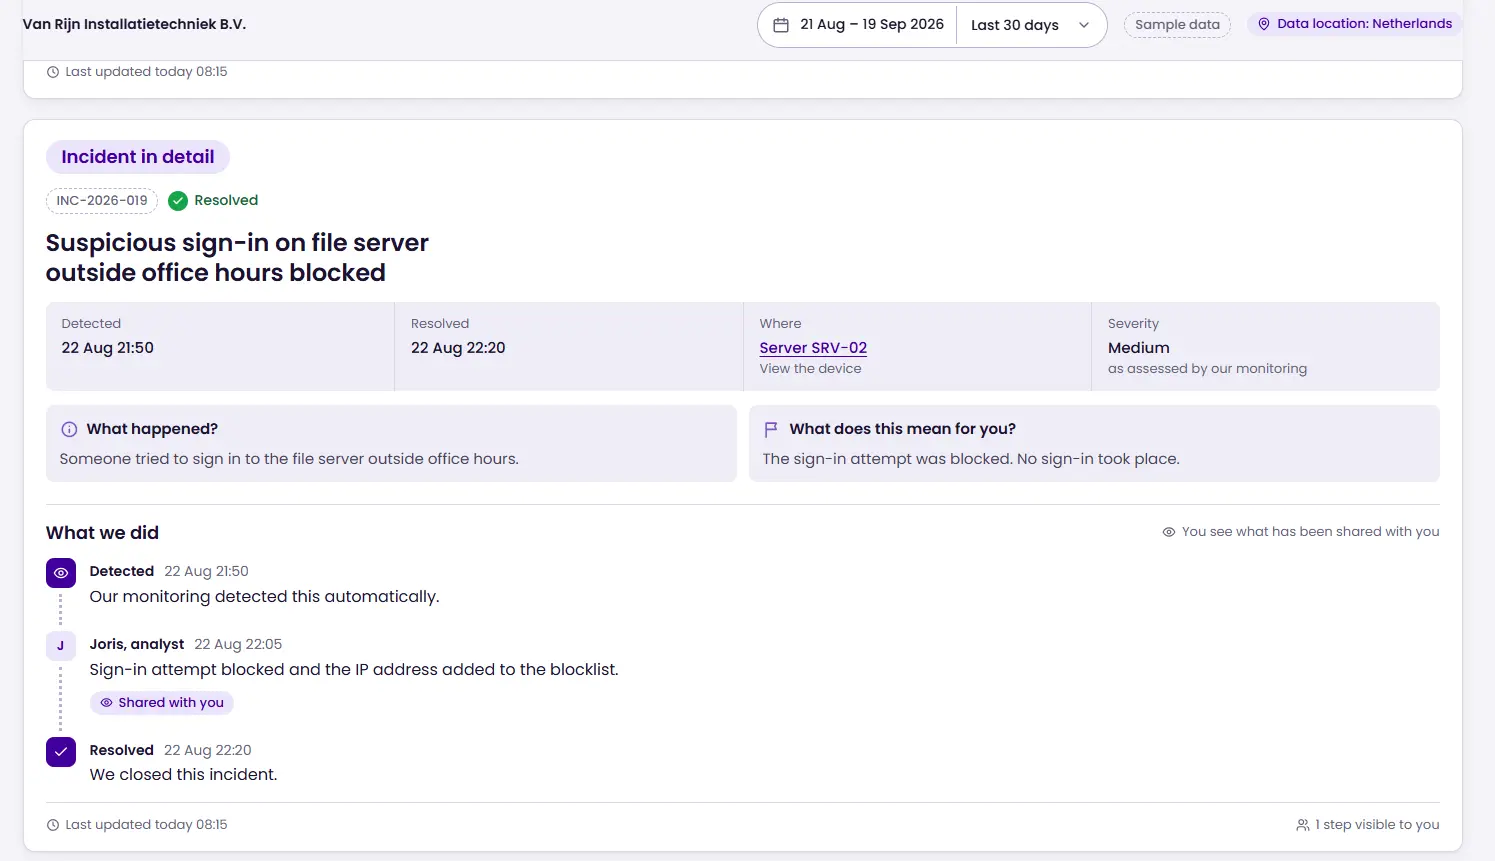
Every action recorded step by step

Full transparency in costs, contracts and monthly incident reporting

Our MDR dashboard in less than 3 minutes

Discover how our own MDR dashboard is structured and what you get in return.

Want to click through the dashboard yourself?

Leave your email address and we will schedule a short demo with you. You will see which threats we detect, what we handle, and more.
After the demo, you will receive an account to explore it yourself at your own pace. No strings attached and no obligations.
Thank you! We will contact you within one business day to schedule the demo.
Something went wrong while sending. Please try again.

Why use an MDR dashboard?

With our own MDR dashboard, you get a look inside your company's security. You can see what we are monitoring, what we have done for you, and what it costs, without having to ask. No black box, but a glass SOC (Security Operations Center): transparent from start to finish.
‍

You want to know what you are paying

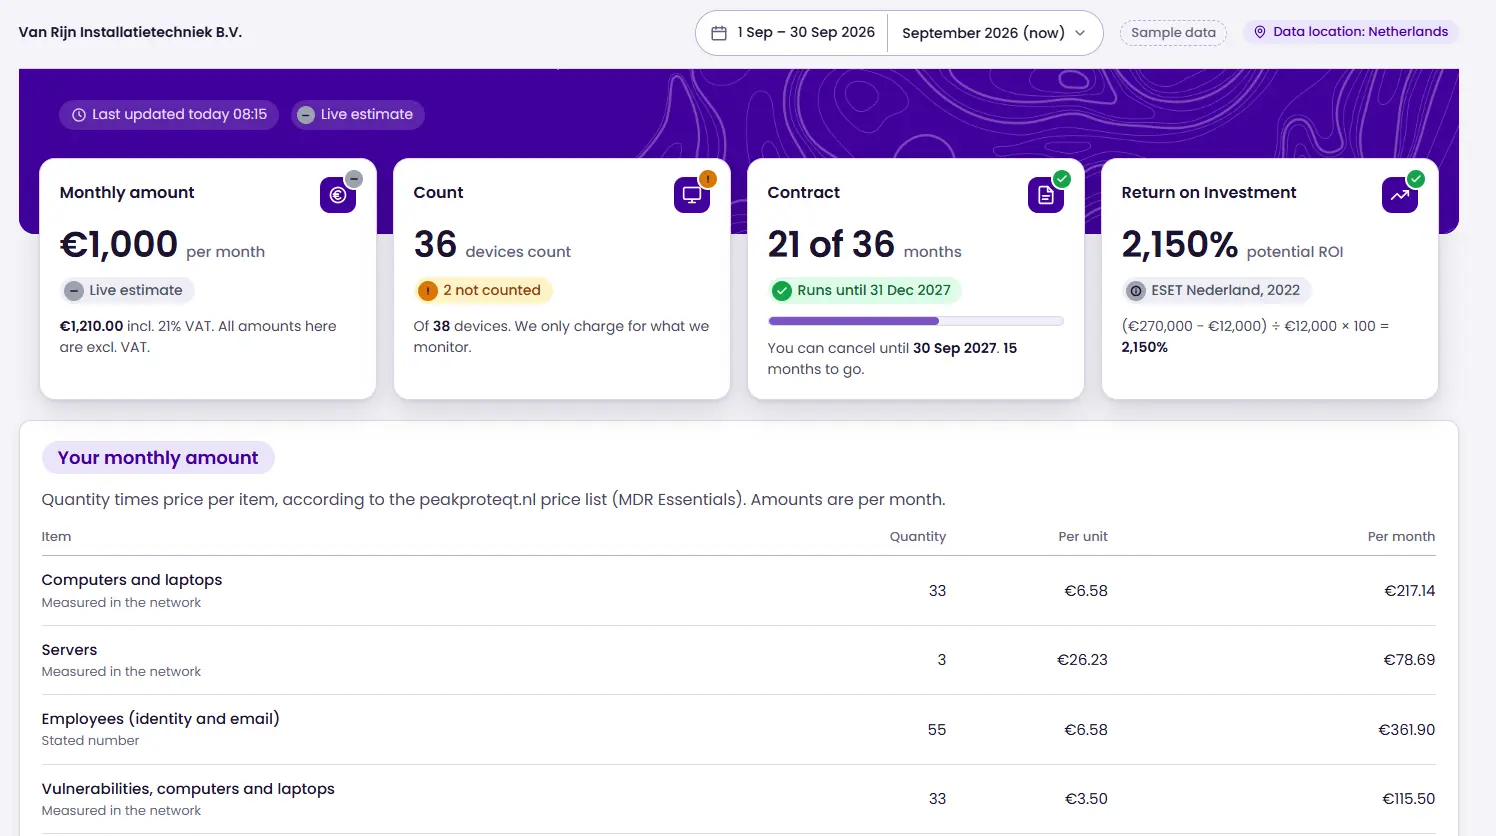
Many security providers give you a single monthly fee and expect you to just assume it’s correct. In our MDR dashboard, we have broken down exactly how your monthly price is calculated. Cybersecurity is intangible, which is why we believe it is extra important for our clients to see how the price is structured and what they get in return.

You want to know what you are paying for

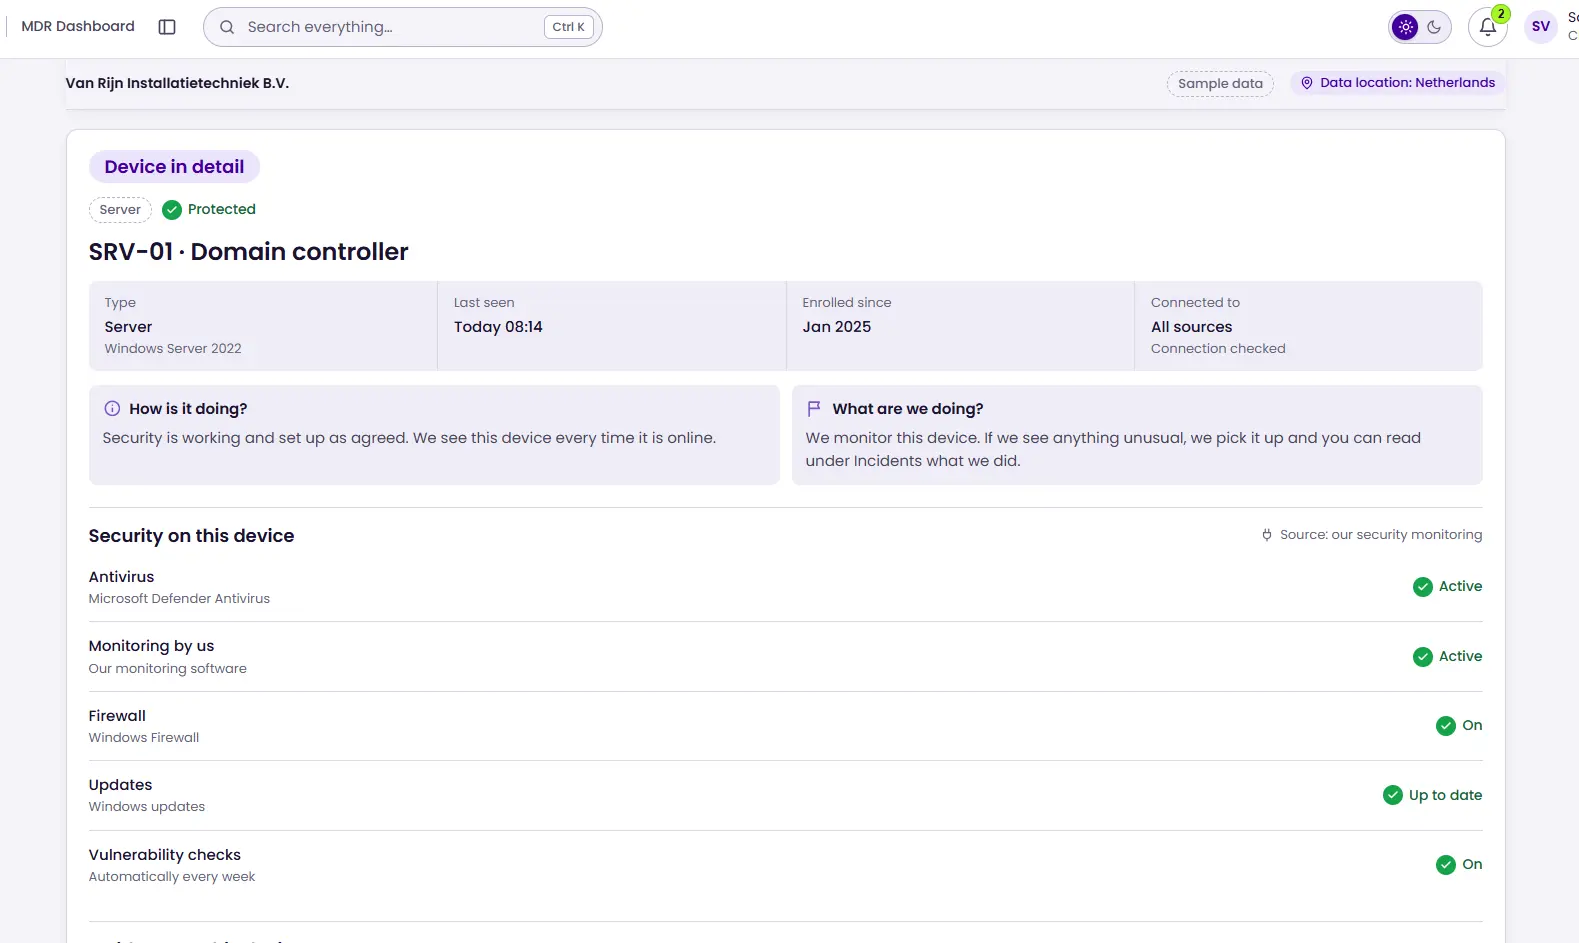
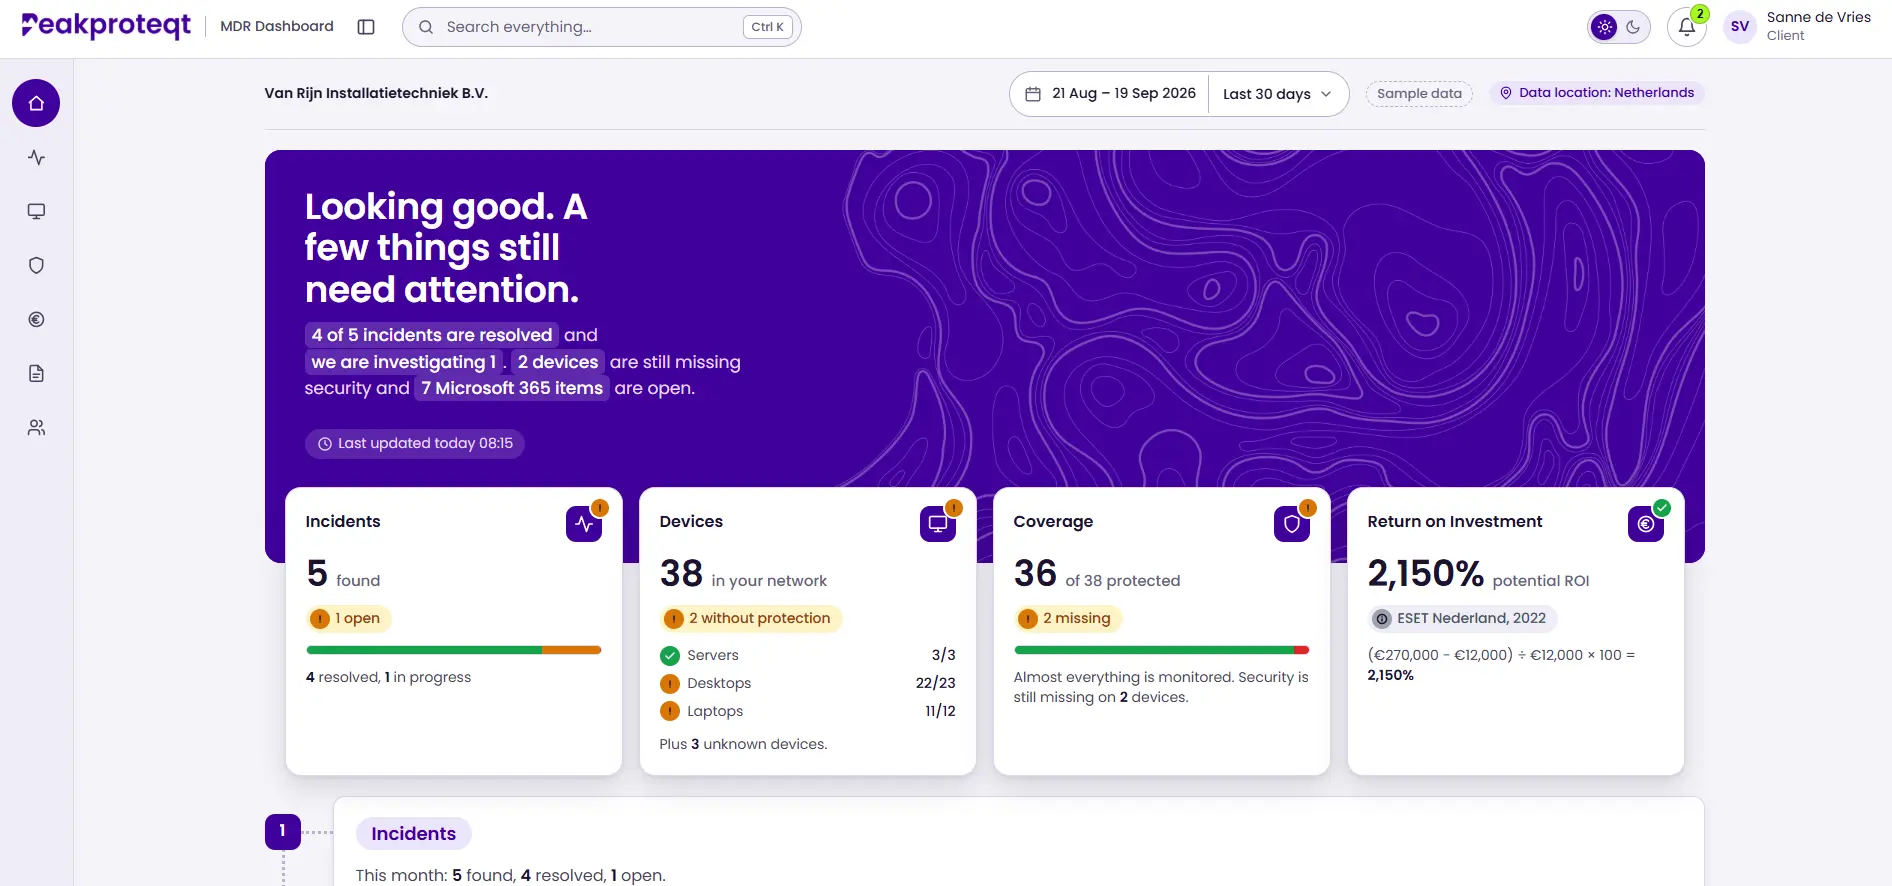
You can see which devices we are protecting, whether the security on them is working, what risks your company faces, and which incidents we have handled. For every incident and risk, you can read exactly what steps we have taken. This allows you to see the value of your security, rather than just having to take our word for it.

You want to move from chaos to clarity

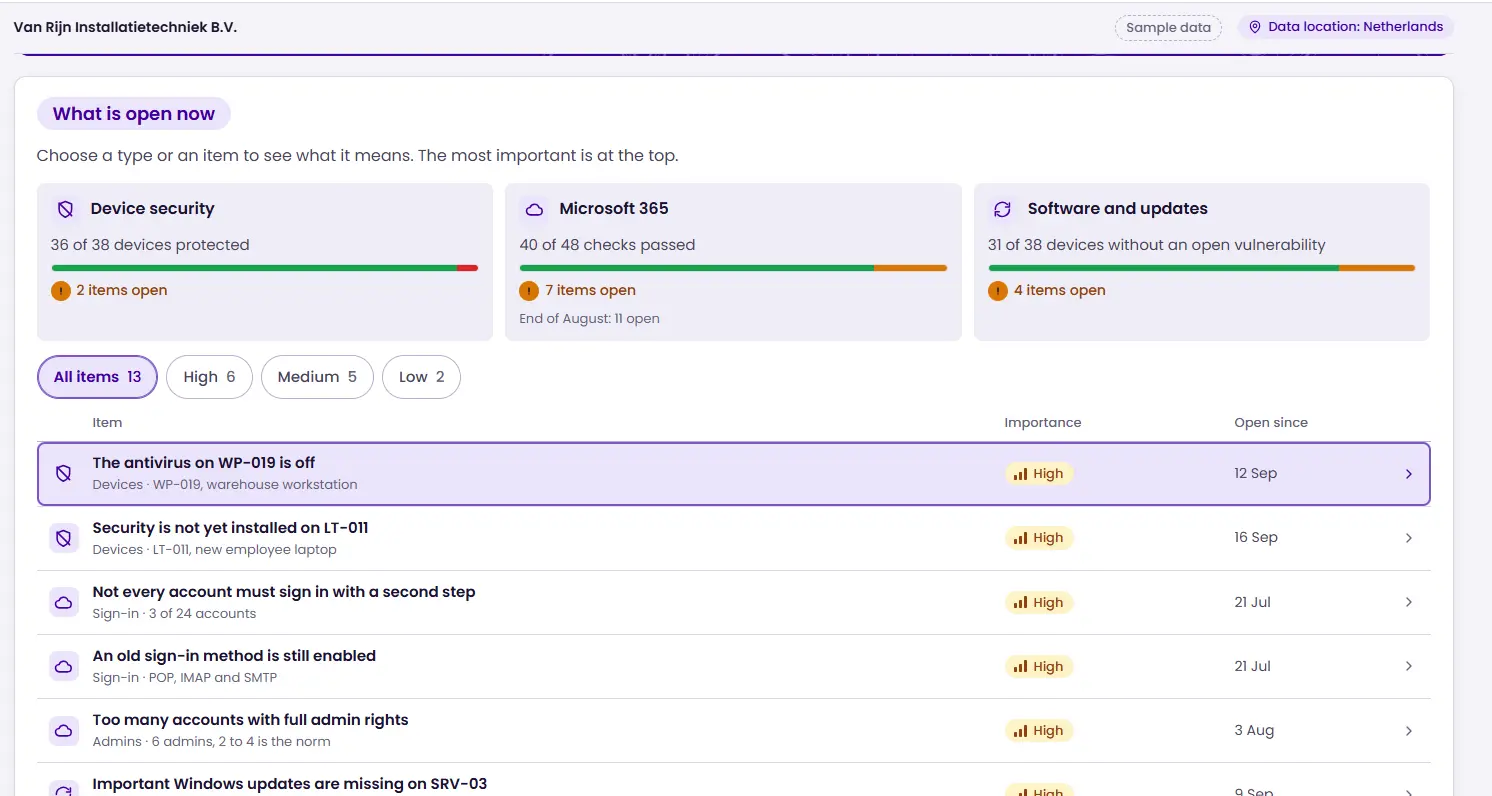
A typical company uses more than twenty tools, resulting in a flood of notifications, emails, and scattered reports. The MDR dashboard brings everything together in one place: incidents, devices, risks, costs, and your contract. At the top of each dashboard section, a single sentence summarizes your current status in plain language. This gives you a quick overview of where your company stands.

What are the benefits of an MDR dashboard?

An MDR dashboard makes the invisible visible, providing peace of mind. It also provides evidence for yourself, your clients, your insurer, or an audit. Furthermore, you can see the ROI (return on investment): what the investment yields compared to the average cost of a cyberattack.
Security status at a glance

Real-time insight
into vulnerabilities

See how, when, and which cyber incidents we resolve

Instant insight
into the ROI of cybersecurity

Your logo and brand colors as an IT service provider on the dashboard

Monthly reports

Who is the MDR dashboard for?

SMEs

IT Service Providers / MSPs

Start a free cybersecurity scan for your company

Get a clear overview of your company's external security posture in under 2 minutes.

What is included in the MDR dashboard?

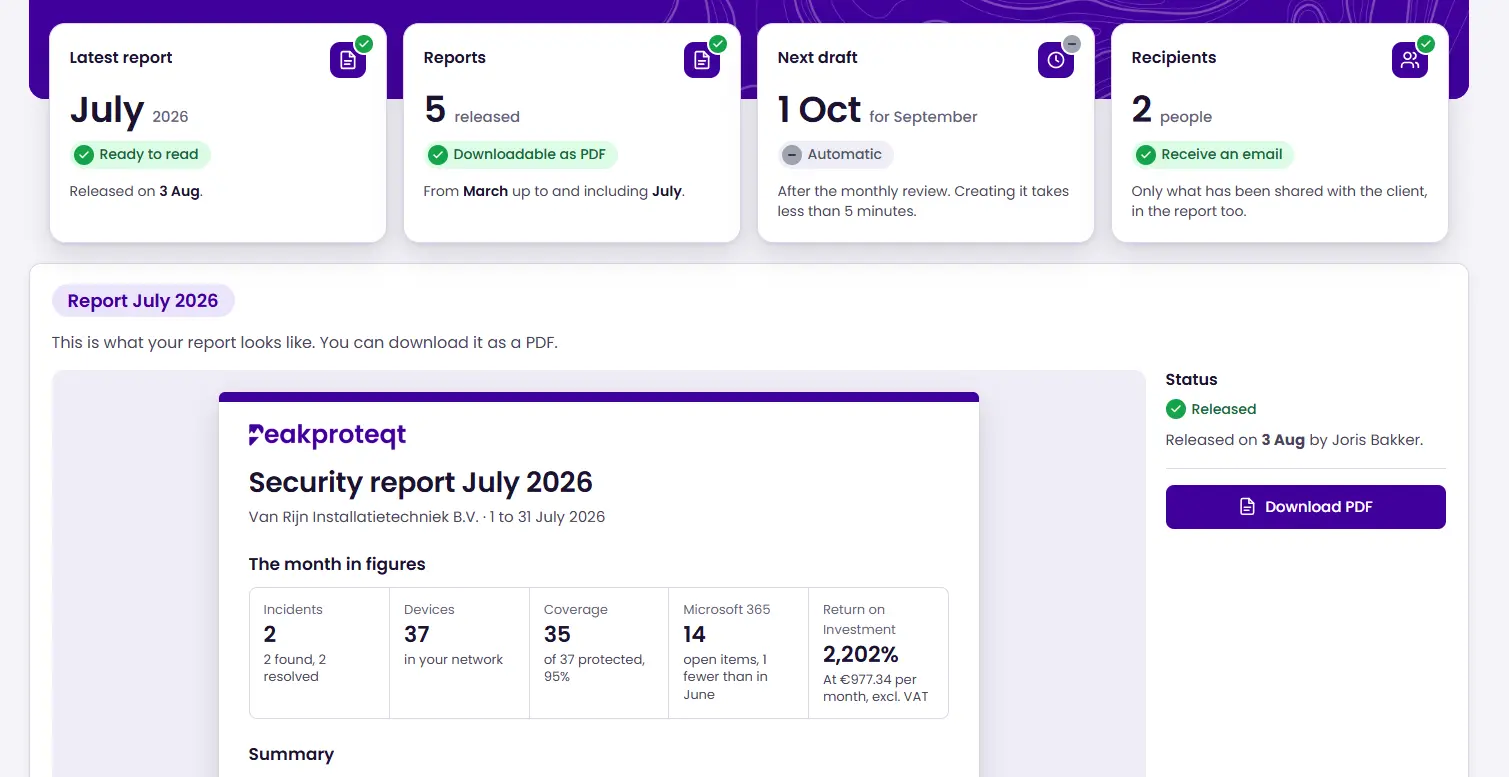
A tour of the MDR dashboard screens: an overview of your company's or clients' security status, incidents with their own timelines, a summary of all your devices and their protection status, risks explained in plain language, a breakdown of costs and contracts, and the monthly report.

How does the MDR dashboard work?

From sign-up to full visibility in three steps. You don't need to build or manage anything yourself.

01

We connect your environment to our tools

We connect the detection and scanning tools on your devices and accounts to the dashboard. The data is updated regularly, and you can see when each figure was last refreshed. This way, you can immediately see if you are looking at the most current data.

02

You receive an account for the dashboard

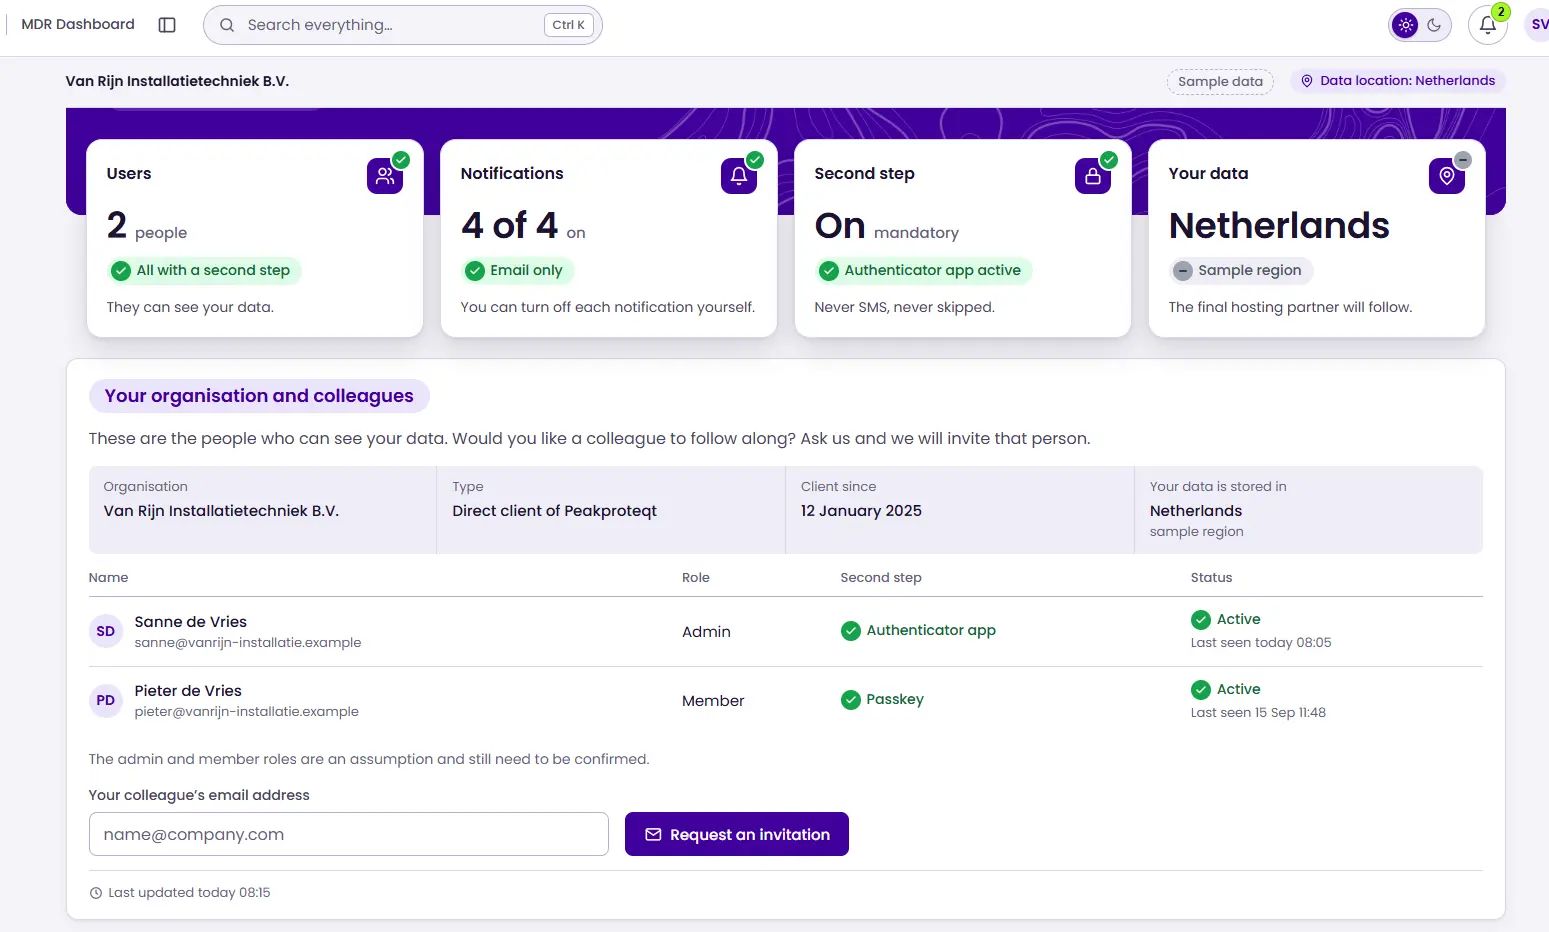
We will create an account for you. Self-registration is not possible because the MDR dashboard is part of the MDR service. You then log in with your password plus two-factor authentication (authenticator app or passkey), ensuring that only you and your team have access. All data is segregated by client and stored in Europe.

03

You now have full visibility and can monitor whenever you like

Monitor what you want, when you want: incidents, devices, risks, costs, and reports. You will receive a notification for any new incident, and your report will be ready every month.

Schedule a demo of the MDR dashboard

Want to see what your company looks like in the MDR dashboard? Leave your email address, and we will schedule a short demo to walk through the screens together. No strings attached.

Thank you! We will contact you within one business day to schedule the demo.
Something went wrong while sending. Please feel free to email us directly.
Microsoft 365
High

Critical updates missing on server DC-SRV-01

Example finding
Resolution time: 1 day
Endpoint & monitoring
Medium

Email security not configured correctly

Example finding
Resolution time: 5 days

Frequently asked questions about the MDR dashboard (FAQ)

What is an MDR dashboard?

+

What is included in the MDR dashboard?

+

Can I use the dashboard for my own customers as an IT service provider?

+

Who can use the MDR dashboard?

+

Where is the data in the dashboard stored?

+